CMIP6 Explainer for Amateurs
Ever wondered how to use climate models? So did we.
This was originally published on Medium
You might have noticed a bunch of news coming out recently about revised climate scenarios and the world being more screwed than we originally thought it was. Why is that all coming out now? Probably a lot of reasons, but one of the biggest is something called CMIP6.
What is CMIP6, You Say?
Several decades ago, in 1995, the climate science community realized it needed to coordinate its efforts around climate modeling so that experiments done in one laboratory (“what will happen to the Greenland ice sheet”) can be cross referenced with experiments done in another laboratory (“how does deforestation in the Amazon contribute to the growth of atmospheric carbon”) without having to do a bunch of converting and reinterpreting and messing with data to make the connections. Out of that desire was born something called the Coupled Model Intercomparison Project ( CMIP) run by an international organization called the World Climate Research Programme (WCRP). CMIP has had several iterations over the years, but the three you’ll probably encounter the most are the no-longer-used CMIP3 in ~2007 and the currently-used CMIP5 in ~2012 and the soon-to-be-used CMIP6 which is just starting to come out in 2021 and will probably finish in the next year or so.
As parts of CMIP6 come out, some features of the data are already starting to make headlines, most notably the finding that global temperatures are probably going to go up more than we originally appreciated (called climate sensitivity)
Anyway, in starting off my new venture, I’ve been doing a lot of learning about CMIP6. There’s an incredible amount of data being exposed by thousands of talented researchers. And, in a business-thesis-validating revelation: it’s completely incomprehensible to normal people, even technically savvy normal people. So, I’m about to drop some knowledge to make it less confusing, right here, right now.
CMIP Isn’t One Thing, It’s Lots of Things
The first thing to know is that CMIP isn’t really one organization of researchers working on one thing. What it actually is is more than a dozen different laboratories around the world working independently on what they probably would have worked on anyway, but, in doing so, making some relatively standard base assumptions and reporting back in relatively standard formats.
Climate Researchers Love Acronyms
Scientists, as a species, love acronyms. International governing bodies love them even more. What do you get when you gather a bunch of scientists together into an international governing body? Mind-blowing acronyms.
Part of what makes understanding CMIP difficult is every last freaking thing is an incomprehensible acronym. Take the official “summary table of currently available data” page. You might, rightly, assume you’d see something like “if you want to see projected rainfall through 2100, it’s here” kind of stuff, but, instead, what you get is this totally incomprehensible (to outsiders) vomit of acronyms:
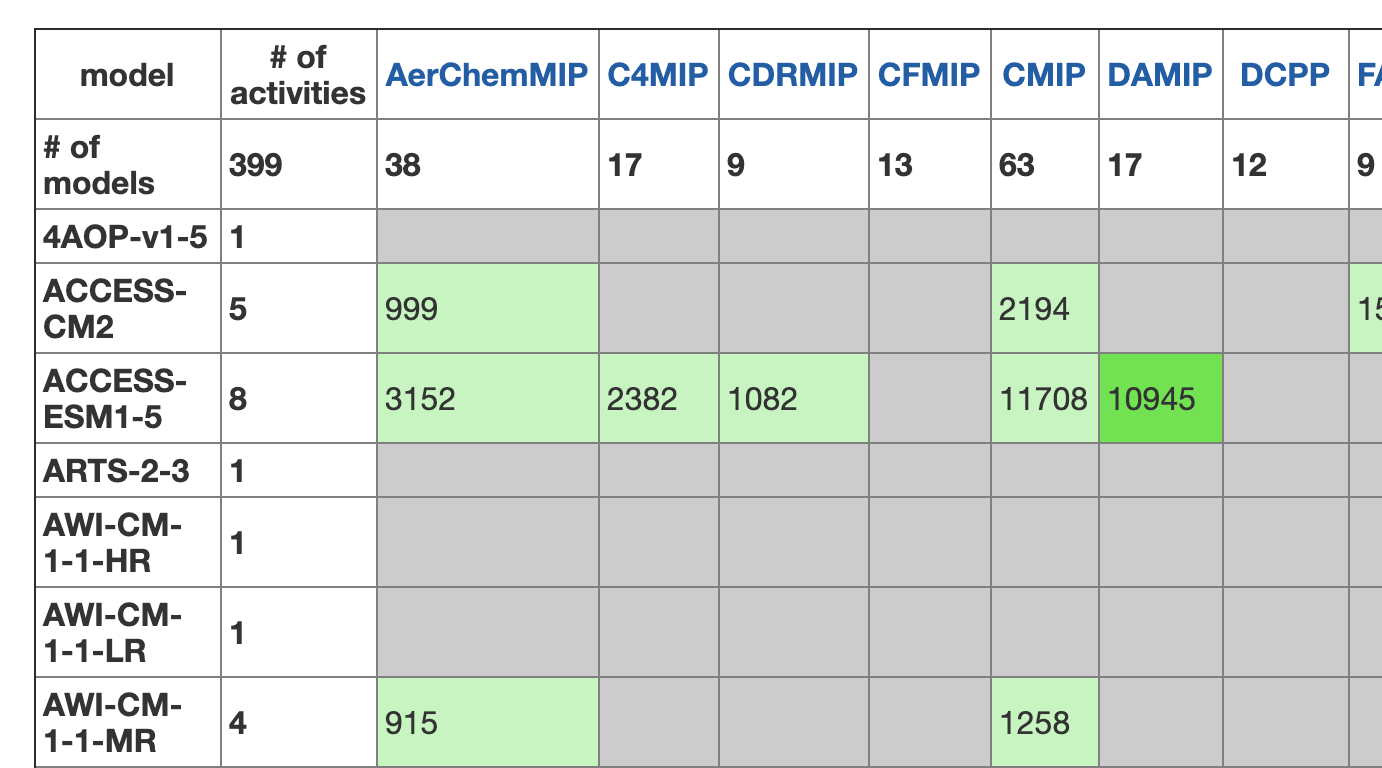
Trying to click around and figure out what those acronyms mean immediately gets you mired in a vocabulary of innocent-sounding terms like “model” and “experiment” and “variable” and “activity” that you feel like you should know, but quickly realize you have no idea what they mean, actually. Pretty soon, in trying to answer your seemingly-simple question “what is the projected rainfall through 2100” you’re still…lost. So, I’ll try to save you the three solid days I spent orienting myself by breaking it down right here, starting with what “variable” means.
The Thing You Actually Care About is A Variable
You’re probably coming to this field with a particular question in mind. The example question I’ll use is “what is the projected rainfall through 2100”. In that question, the “variable”, in CMIP6-speak, is “rainfall”. Or, more specifically, the super-descriptively-named variable “pr” for “precipitation”. Not all data sets contain all variables. In fact, probably zero data sets contain all the variables. For that matter, any given data set will only contain a pretty small subset of all the possible variables. What are all the possible variables, you ask? Well, they’re in a super-easy-to-understand official list of variables , of course.
I’m kidding, they’re not easy to understand at all, unless you’re a climate scientist.
There are hundreds of variables. Most of them only make sense to climate scientists (e.g. “cfadLidarsr532” for “CALIPSO Scattering Ratio”). A few of them, you, as an amateur, actually do care about. Here are some of those more amateur-relevant ones you probably actually care about, to give you a head start:
- What’s the temperature?…
- tas: near surface air temperature and
- ta: air temperature and
- tsl: temperature of soil
- Will it snow and can I ski?…
- snd: snow depth and
- snc: snow area percentage
- How much carbon are we talking about anyway?…
- co2s: atmosphere CO2 and
- co2mass: total atmospheric mass of co2 and
- co2: mole fraction of co2
- Will my tomatoes have any water?…
- pr: precipitation and
- wtd: water table depth and
- dgw: change in groundwater and
- mrtws: terrestrial water storage and
- mrsos: moisture in upper portion of soil column
- Will California still be on fire?…
- fFireAll: how much carbon is going into the atmosphere due to fire from all sources
- Will my Alaskan hunting shack sink into the permafrost?…
- tpf: permafrost layer thickness …and even cool, unexpected stuff like
- flashrate: lightning flash rate and
- fLulccAtmLut: how much carbon is going into the atmosphere due to land-use changes
The values of variables are calculated from a particular run of an “experiment” through a “model”. So, let’s get into what a “model” is, first.
A Model Is A Set Of Assumptions A Particular Lab Made When Running Simulations
Like I’d mentioned before, dozens of different labs across the world are contributing data. The scientific community pretty much agrees, in broad strokes, that certain things are important in simulations. They all care about cloud cover, or changes in land use from forest to agriculture, or how much carbon the ocean can absorb. Where they differ, though, is in the details. How much, exactly, should we assume the average cloud reflects the sun? Should I also try to model leaves breaking down and releasing carbon into nearby water bodies? How many different layers should I divide the ocean and the atmosphere into? All of these differences are captured in different models.
I’m still learning about the different models, but here are some of the important-seeming ones if you’re hoping to narrow your focus a bit:
- The Australians: They’ve put together a model called ACCESS-ESM1.5 that incorporates the land, atmosphere, ocean and ice and all the cycles among them, including the interactive carbon cycle.
- The Do-It-Yourselfers: Sponsored by the National Science Foundation in the United States, you can run climate models yourself if you have enough Linux machines and patience, using the CESM2 model.
- The Europeans: If you’re a Europhile at heart, you can use the EC-Earth3 model from a consortium of European countries.
- Good, Old NASA: I have a soft spot in my heart for NASA, and if you do, too, then you want the GISS-E2.1-G model from the good folks in the Goddard Institute for Space Studies.
- Japan: If you want to branch out of the Western world, which, frankly, feels overrepresented so far, then check out the MRI-ESM2.0 model out of Japan for a different perspective.
Anyway, the main point to keep in mind as a relative amateur is that models are kind of like a software program: you put some data in and you get some data out. The data you get out is “variables”. The data you put in, loosely-speaking, is an “experiment”.
An Experiment Is Like a Description of an Alternate World
Climate researchers are constantly asking things like “what if this happened” or “what if that happened”. As in, “what if, just for lulz, we assumed that carbon in the atmosphere quadrupled instantly, overnight?” which is a real experiment referred to by the super-descriptive name “abrupt-4xCO2”. Want to know what all the experiments are? No problem! Check out the easy-to-read official Github repo. Too hard to read? The same thing was helpfully rendered into an easy-to-read HTML form, too.
By now, you’ve probably figured out I’m always being facetious when I say “super easy to read”.
Non-climate-scientists mostly don’t care about most of these experiments. They’re conducted in order to help scientists find better insights, but most of them are not that helpful for “tell me what’s likely to happen in the real world that I actually live in.” Well, dear reader, I’ve extracted some of those more-useful-to-us experiments here to give you a head start:
- historical and historical-ext: these are the “normal” experiments that most of the articles you read in the media are probably referring to whenever they’re talking about “this is what the normal temperature was like each year between 1850 and now-ish”. The only thing not in here is historical CO2 concentrations
- esm-hist and esm-hist-ext: these are the “normal” experiments that try to spell out how much CO2 was in the air between 1850 and now-ish
- ssp119, ssp126, ssp245, ssp370, ssp434, ssp460, ssp585: these are the experiments that try to predict the future under various scenarios like “we’re globally-coordinated eco-superheroes (ssp119)” or “Big Oil forces us to burn fossil fuel indefinitely like the crack addicts we are (ssp585)”. These are the experiments being referenced in the “this is how screwed we are” articles you’re probably reading on Vox
For that last set of experiments, you probably noticed a naming convention of “ssp” followed by some numbers. That’s not an accident.
CMIP6 Uses Standardized Societal and CO2 Assumptions for Predictions
This is probably the coolest innovation to come out of CMIP: standardized future scenarios. So, instead of each lab making predictions based on slightly different values of “how does humanity respond to climate change” we’ve now standardized a universal set of possible scenarios. In CMIP5, things were easy and there was only one axis of assumptions called Representative Concentration Pathways (RCP) which were represented with names like RCP2.6 and RCP8.5. With RCPs, lower numbers generally (but not exactly) meant “humanity pumps less CO2 into the atmosphere” and higher numbers generally meant “humanity pumps more CO2 into the atmosphere”. The media tended to describe RCP8.5 as “business as usual, worst case scenario” and tended to describe RCP4.5 as “we get our act together relatively soon”.
Well, it turns out it’s not that simple. So, in CMIP6, the scientific community decided to create a two-dimensional grid of “what’s happening in the atmosphere”, which was always represented by RCP, and crossed it with “how is humanity accomplishing that”, now represented by the new Shared Socioeconomic Pathways (SSP) classifications.
SSP1 roughly means “we all hold hands and do the right thing together”. Frustratingly, unlike with RCP, you can’t assume a lower number (i.e. “1”) is “worse” or “better” than a higher number. There are five SSPs, roughly described as:
- SSP1, Sustainability: we all hold hands and do the right thing together at a sustainable pace while living in yurts.
- SSP2, Middle of the road: we pretty much kind of lurch toward the right thing, incrementally, and at varying paces across countries.
- SSP3, Regional rivalry: this is kind of the worst case scenario, where nationalism takes hold and everyone does the selfish, short term thing in isolation. Kind of a Mad Max Fury Road scenario.
- SSP4, Inequality: the rich countries do the right thing, but the poor countries are screwed. Kind of the Hunger Games scenario.
- SSP5, Fossil-Fueled Development: we all buy the fantasy that we can innovate and carbon capture our way out of this mess without giving up our fossil fuels. Global capitalism rules the day. Kind of the Minority Report scenario.
So, under CMIP6, if you want to talk about the future you have to talk about an intersection of one SSP with one RCP. There are 5 SSPs and 7 RCPs, for a total of 5 x 7 = 35 different futures to talk about. However, some of those intersections obviously don’t make sense. For example, it’s very unlikely that SSP1 x RCP8.5 will happen, so it’s not worth talking about it. Likewise, only in the Koch brothers’ wildest fever dreams is SSP5 x RCP1.9 ever going to happen. So, CMIP spells out four “tier 1” combinations of the two that they encourage people to use:
- SSP5 / RCP 8.5: we’re so doomed it’s actually quite unrealistic, but is still a useful upper bound on doomedness
- SSP3 / RCP 7.0: the more realistic “we’re doomed" scenario that best represents “business as usual”
- SSP2 / RCP 4.5: the more realistic “we get our act together, pretty much, but not quickly” scenario
- SSP1 / RCP 2.6: the barely-realistic, optimistic scenario, pretty much tracking to the now-seemingly-unachievable Paris Climate Agreement
So, there you go. A guided tour of what’s actually a very complicated subject. You must feel like you have all the tools you need to understand climate change’s impact on your organization, right? Yeah…probably not. But, fear not, here at pollen.io we’re working on an even more comprehensive guide (plus some helpful tools) to make this all even easier for non-climate-scientists to use.
See you soon!


2023 © Pollen Analytics LLC. ALL Rights Reserved.